Hi,
Environment - self hosted multi-node CommCare instance
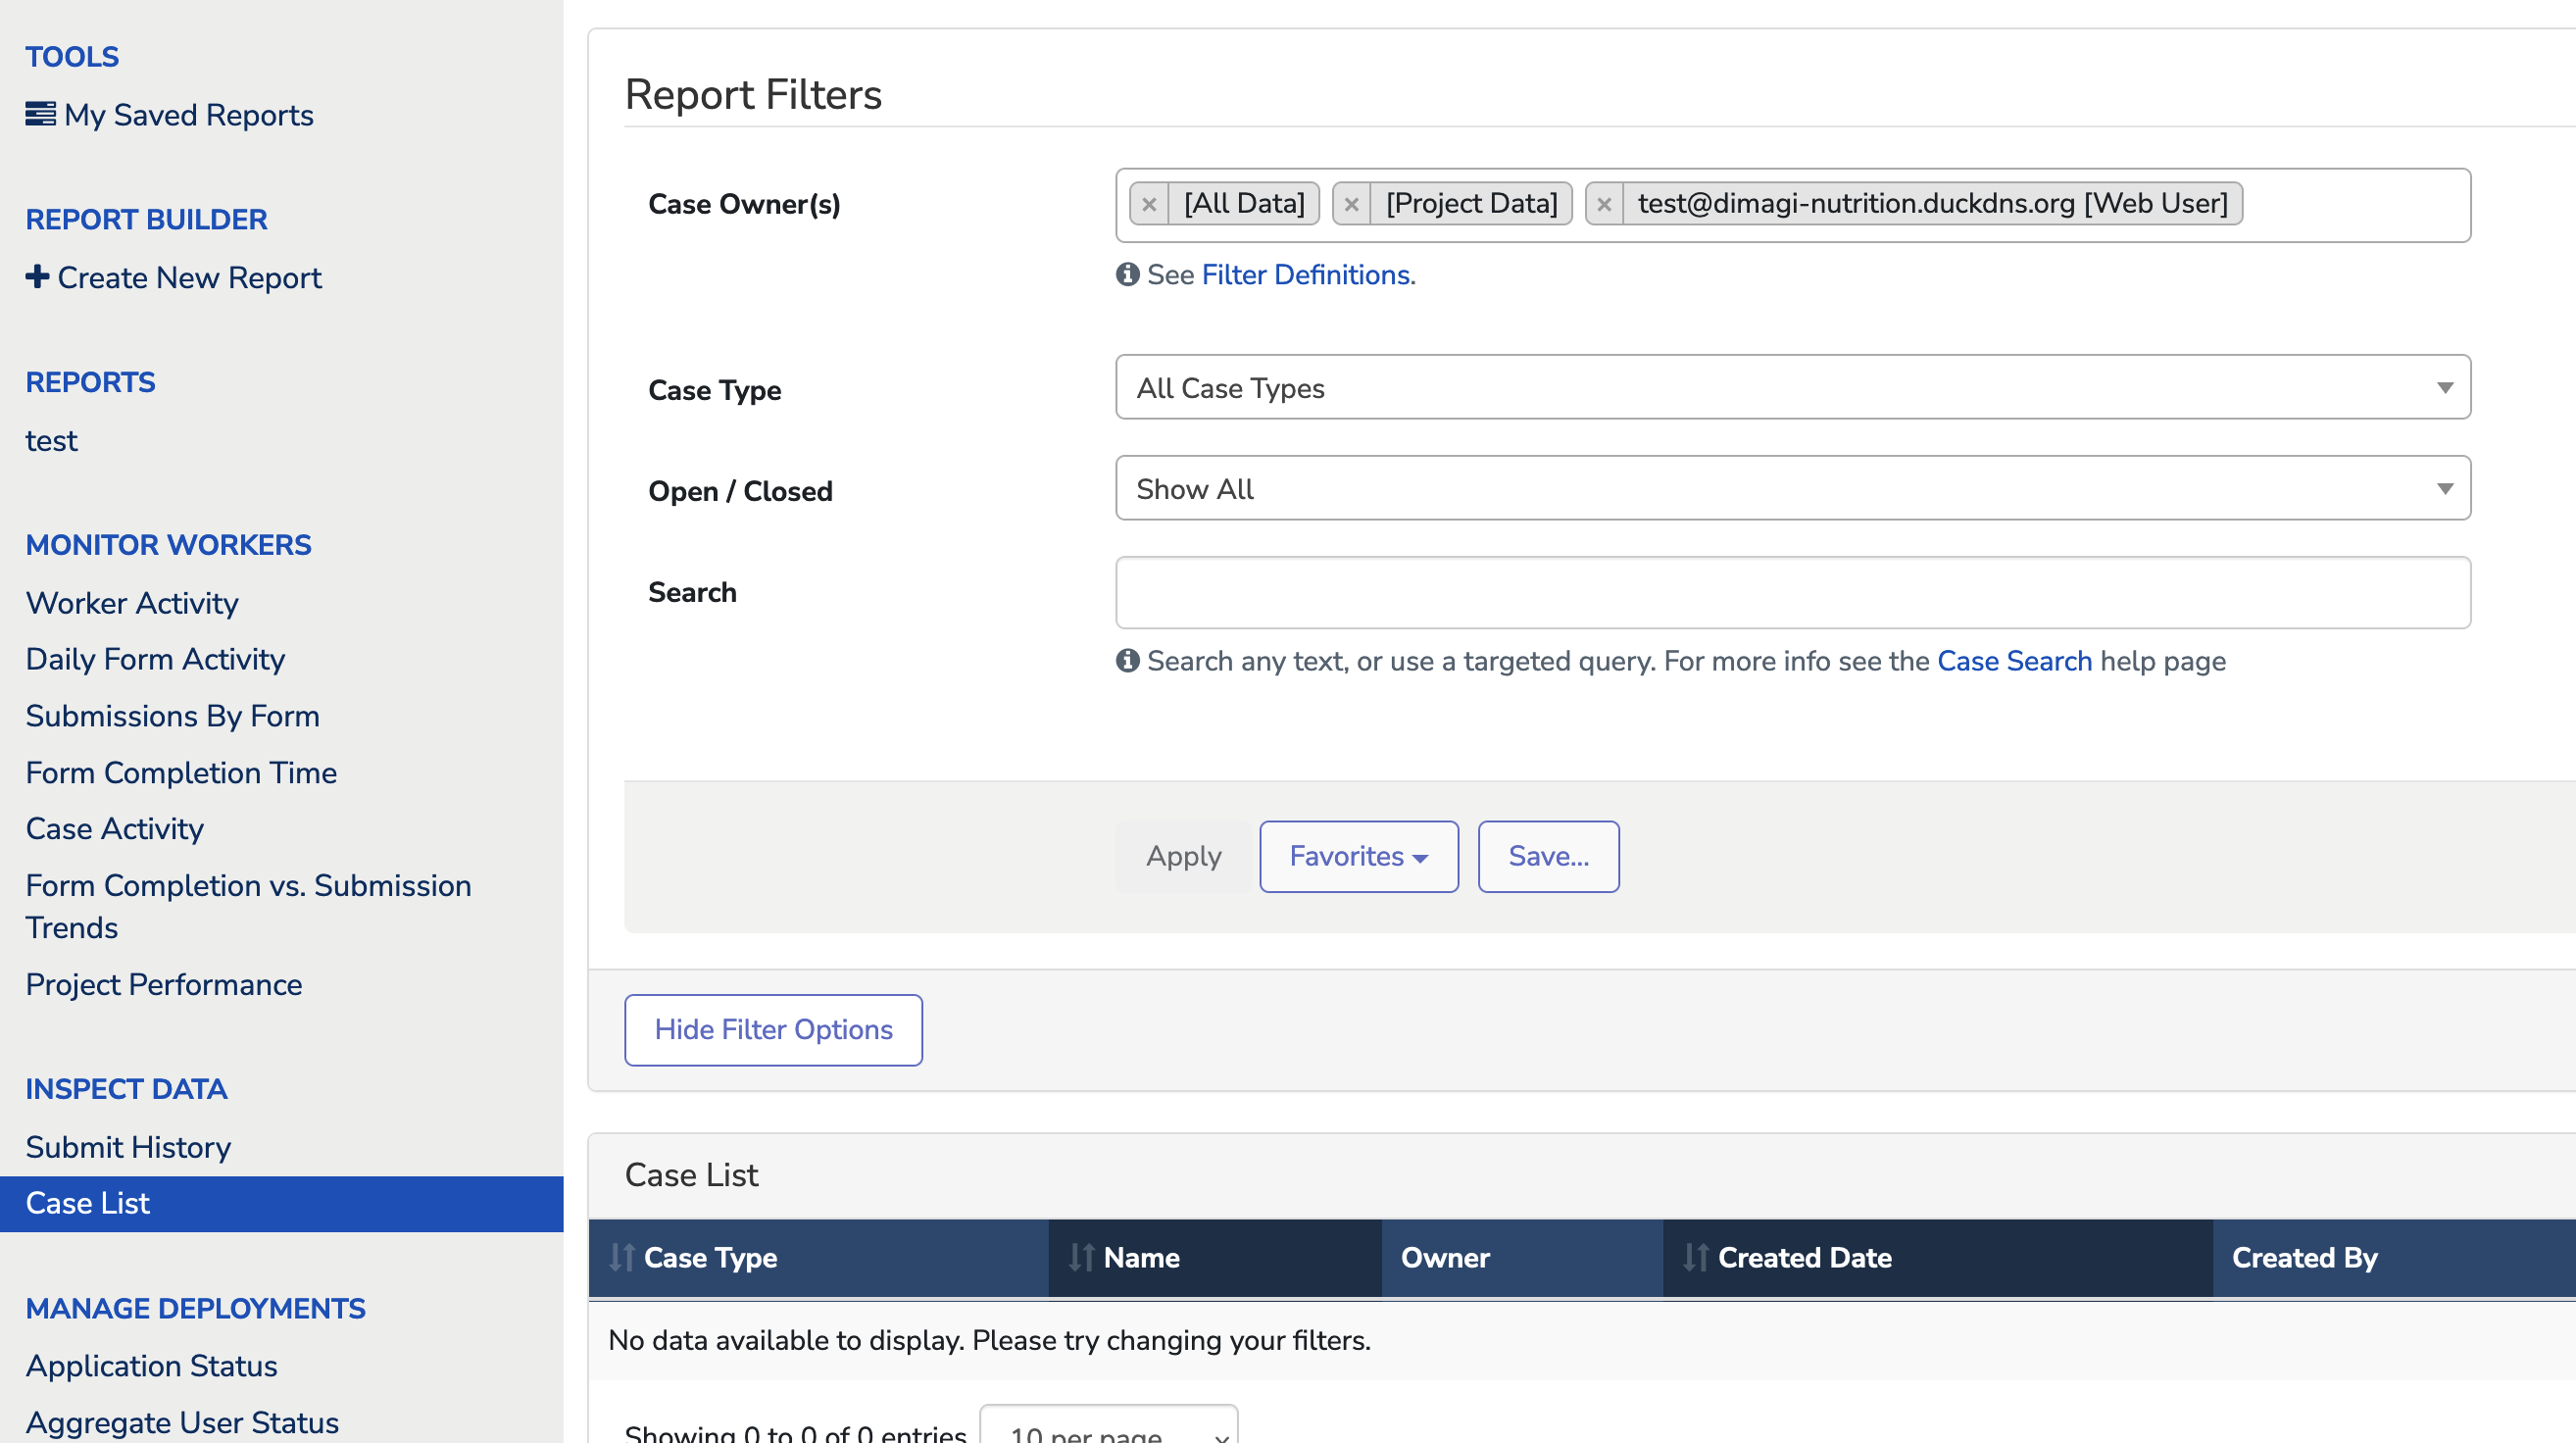
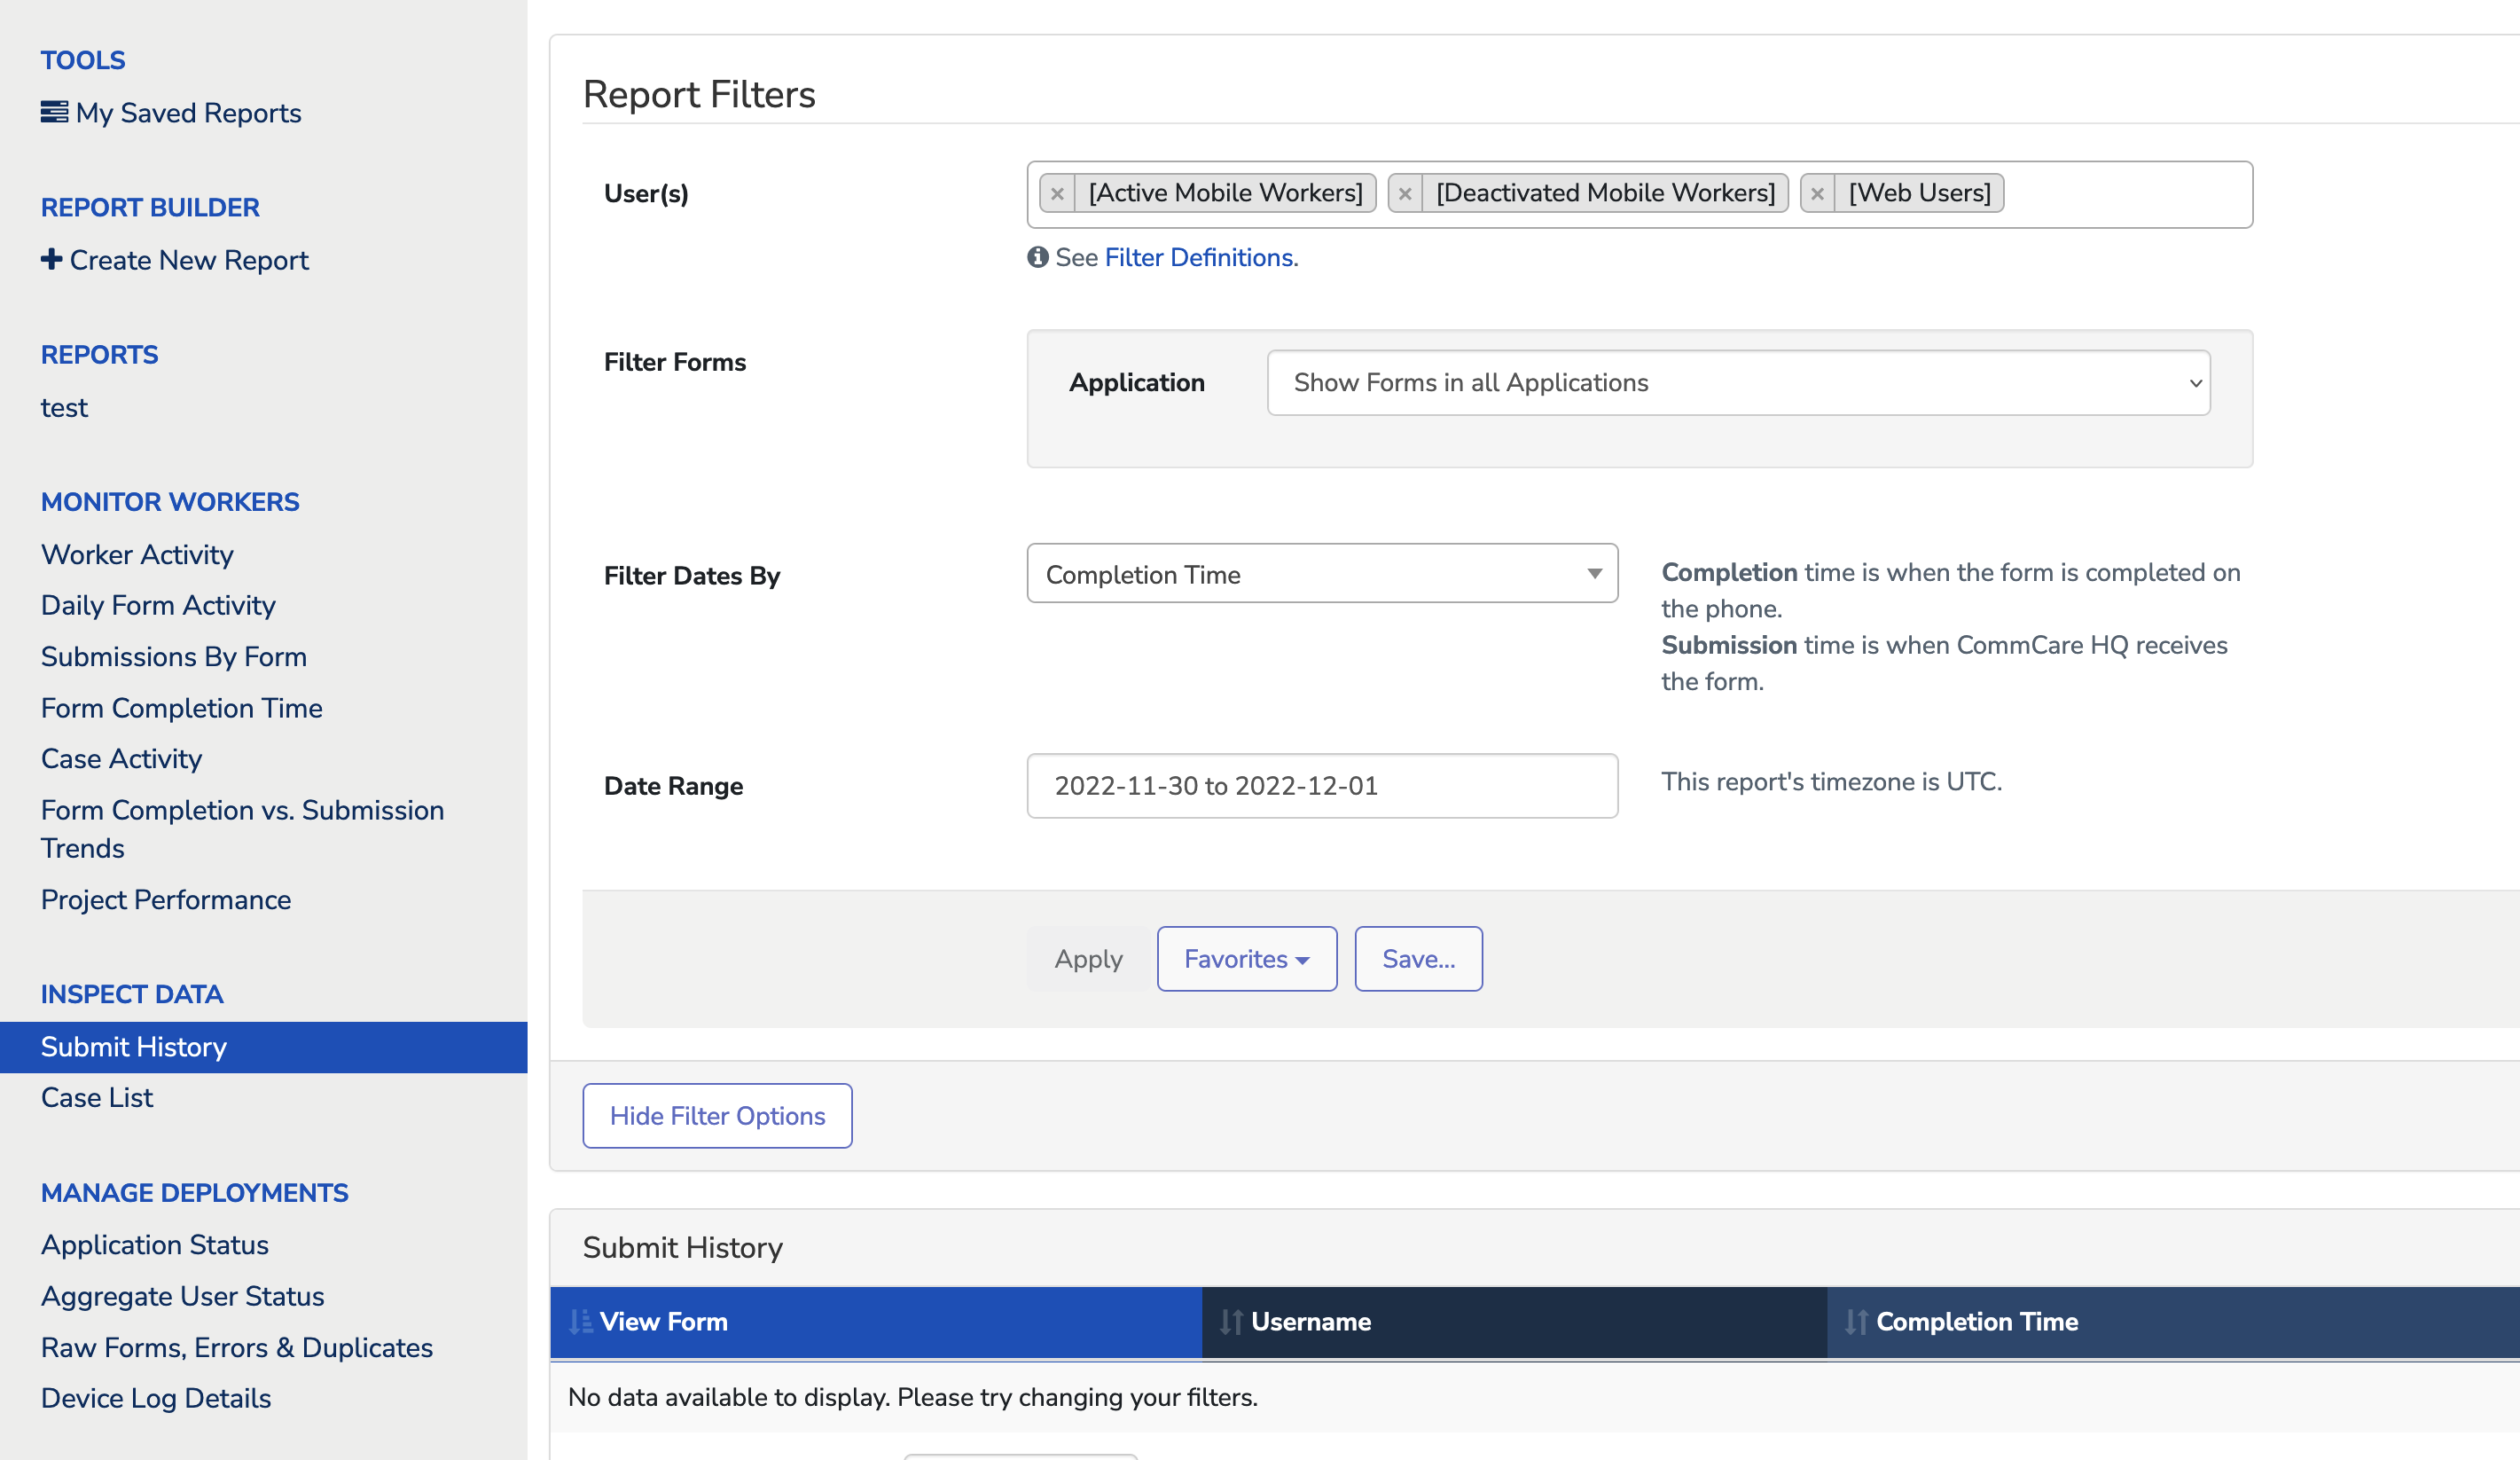
Issue - A new form and case is created using web app and it is not visible both in 'Submit History' and 'Case List' reports.
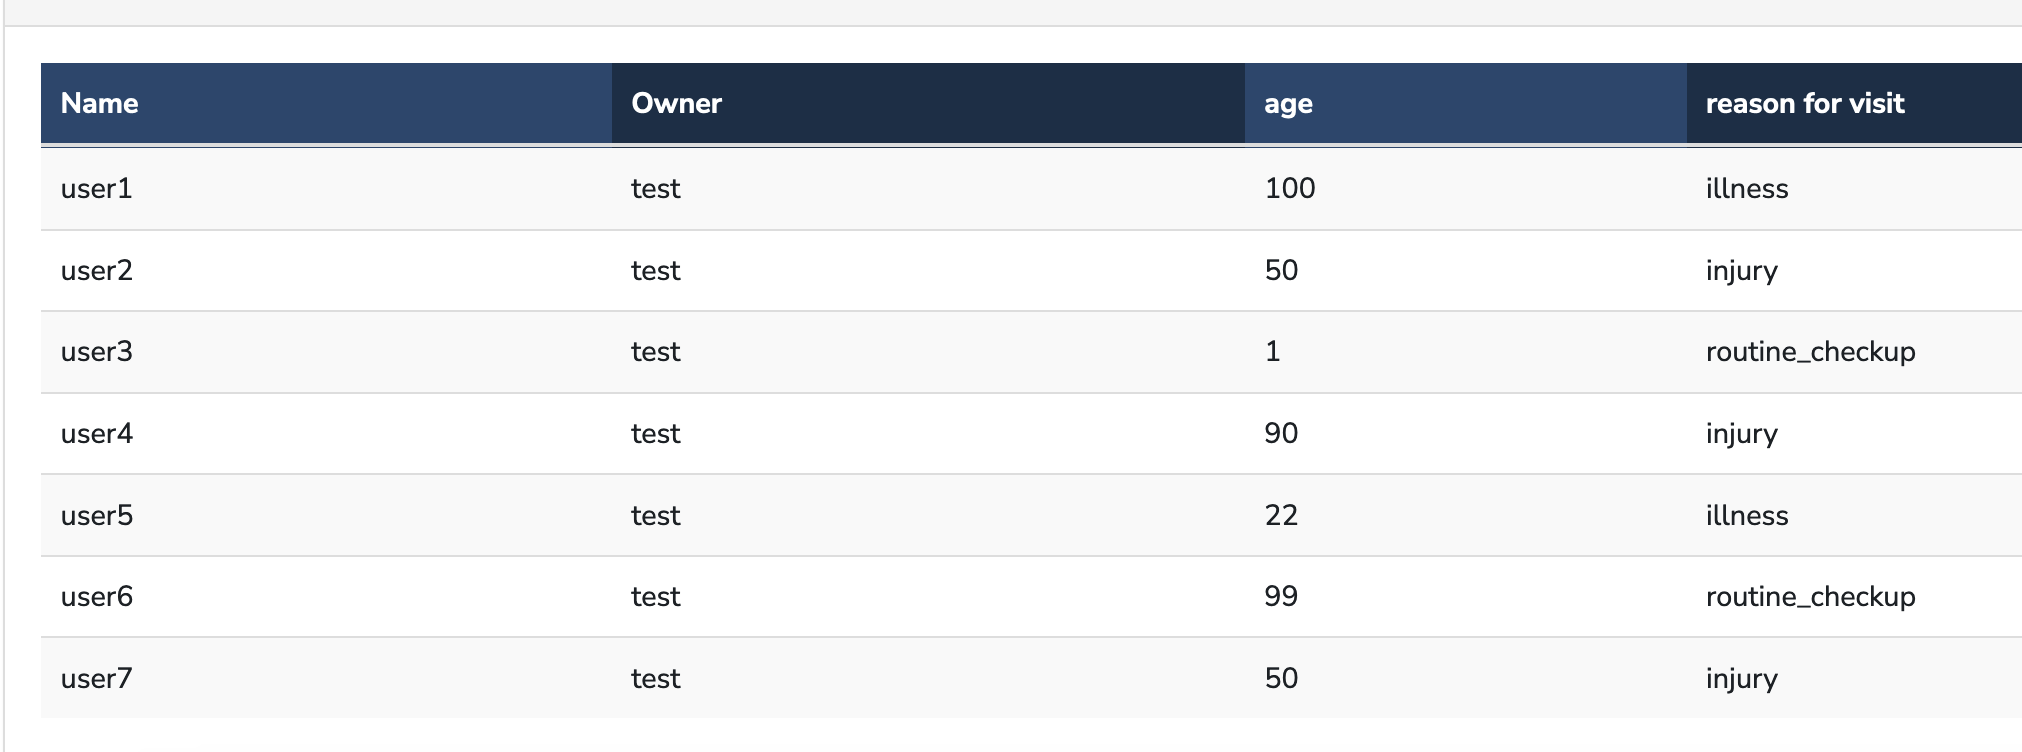
Data(user7) is visible in report:
Service status:
Elasticsearch
10.0.0.16 | CHANGED | rc=0 >>
● elasticsearch.service - Elasticsearch 2.4.6
   Loaded: loaded (/etc/systemd/system/elasticsearch.service; enabled; vendor preset: enabled)
   Active: active (running) since Thu 2022-12-01 02:20:16 UTC; 1h 55min ago
     Docs: http://www.elastic.co
 Main PID: 1344 (java)
    Tasks: 55 (limit: 4915)
   CGroup: /system.slice/elasticsearch.service
           └─1344 /usr/bin/java -Xms2048m -Xmx2048m -Djava.awt.headless=true -XX:+UseParNewGC -XX:+UseConcMarkSweepGC -XX:CMSInitiatingOccupancyFraction=75 -XX:+UseCMSInitiatingOccupancyOnly -Dfile.encoding=UTF-8 -Djna.nosys=true -Des.path.home=/opt/elasticsearch-2.4.6 -cp /opt/elasticsearch-2.4.6/lib/elasticsearch-2.4.6.jar:/opt/elasticsearch-2.4.6/lib/* org.elasticsearch.bootstrap.Elasticsearch start --path.conf=/etc/elasticsearch-2.4.6 --path.home=/opt/elasticsearch-2.4.6

Dec 01 02:20:16 elastic2 systemd[1]: Started Elasticsearch 2.4.6.
10.0.0.15 | CHANGED | rc=0 >>
● elasticsearch.service - Elasticsearch 2.4.6
   Loaded: loaded (/etc/systemd/system/elasticsearch.service; enabled; vendor preset: enabled)
   Active: active (running) since Thu 2022-12-01 02:20:16 UTC; 1h 55min ago
     Docs: http://www.elastic.co
 Main PID: 1410 (java)
    Tasks: 54 (limit: 4915)
   CGroup: /system.slice/elasticsearch.service
           └─1410 /usr/bin/java -Xms2048m -Xmx2048m -Djava.awt.headless=true -XX:+UseParNewGC -XX:+UseConcMarkSweepGC -XX:CMSInitiatingOccupancyFraction=75 -XX:+UseCMSInitiatingOccupancyOnly -Dfile.encoding=UTF-8 -Djna.nosys=true -Des.path.home=/opt/elasticsearch-2.4.6 -cp /opt/elasticsearch-2.4.6/lib/elasticsearch-2.4.6.jar:/opt/elasticsearch-2.4.6/lib/* org.elasticsearch.bootstrap.Elasticsearch start --path.conf=/etc/elasticsearch-2.4.6 --path.home=/opt/elasticsearch-2.4.6

Dec 01 02:20:16 elastic1 systemd[1]: Started Elasticsearch 2.4.6.
10.0.0.17 | CHANGED | rc=0 >>
● elasticsearch.service - Elasticsearch 2.4.6
   Loaded: loaded (/etc/systemd/system/elasticsearch.service; enabled; vendor preset: enabled)
   Active: active (running) since Thu 2022-12-01 02:20:28 UTC; 1h 55min ago
     Docs: http://www.elastic.co
 Main PID: 1390 (java)
    Tasks: 54 (limit: 4915)
   CGroup: /system.slice/elasticsearch.service
           └─1390 /usr/bin/java -Xms2048m -Xmx2048m -Djava.awt.headless=true -XX:+UseParNewGC -XX:+UseConcMarkSweepGC -XX:CMSInitiatingOccupancyFraction=75 -XX:+UseCMSInitiatingOccupancyOnly -Dfile.encoding=UTF-8 -Djna.nosys=true -Des.path.home=/opt/elasticsearch-2.4.6 -cp /opt/elasticsearch-2.4.6/lib/elasticsearch-2.4.6.jar:/opt/elasticsearch-2.4.6/lib/* org.elasticsearch.bootstrap.Elasticsearch start --path.conf=/etc/elasticsearch-2.4.6 --path.home=/opt/elasticsearch-2.4.6

Dec 01 02:20:28 elastic3 systemd[1]: Started Elasticsearch 2.4.6.
Pillowtop
10.0.0.10 | CHANGED | rc=0 >>
commcare-hq-dns-pillowtop-AppDbChangeFeedPillow-0              RUNNING   pid 20108, uptime 0:38:40
commcare-hq-dns-pillowtop-ApplicationToElasticsearchPillow-0   RUNNING   pid 20109, uptime 0:38:40
commcare-hq-dns-pillowtop-CacheInvalidatePillow-0              RUNNING   pid 20110, uptime 0:38:40
commcare-hq-dns-pillowtop-DefaultChangeFeedPillow-0            RUNNING   pid 20111, uptime 0:38:40
commcare-hq-dns-pillowtop-DomainDbKafkaPillow-0                RUNNING   pid 20112, uptime 0:38:40
commcare-hq-dns-pillowtop-KafkaDomainPillow-0                  RUNNING   pid 20113, uptime 0:38:40
commcare-hq-dns-pillowtop-LedgerToElasticsearchPillow-0        RUNNING   pid 20114, uptime 0:38:40
commcare-hq-dns-pillowtop-SqlSMSPillow-0                       RUNNING   pid 20115, uptime 0:38:40
commcare-hq-dns-pillowtop-UpdateUserSyncHistoryPillow-0        RUNNING   pid 20116, uptime 0:38:40
commcare-hq-dns-pillowtop-UserCacheInvalidatePillow-0          RUNNING   pid 20117, uptime 0:38:40
commcare-hq-dns-pillowtop-UserGroupsDbKafkaPillow-0            RUNNING   pid 20118, uptime 0:38:40
commcare-hq-dns-pillowtop-case-pillow-0                        RUNNING   pid 20119, uptime 0:38:40
commcare-hq-dns-pillowtop-group-pillow-0                       RUNNING   pid 20120, uptime 0:38:40
commcare-hq-dns-pillowtop-user-pillow-0                        RUNNING   pid 20121, uptime 0:38:40
commcare-hq-dns-pillowtop-xform-pillow-0                       RUNNING   pid 20122, uptime 0:38:40
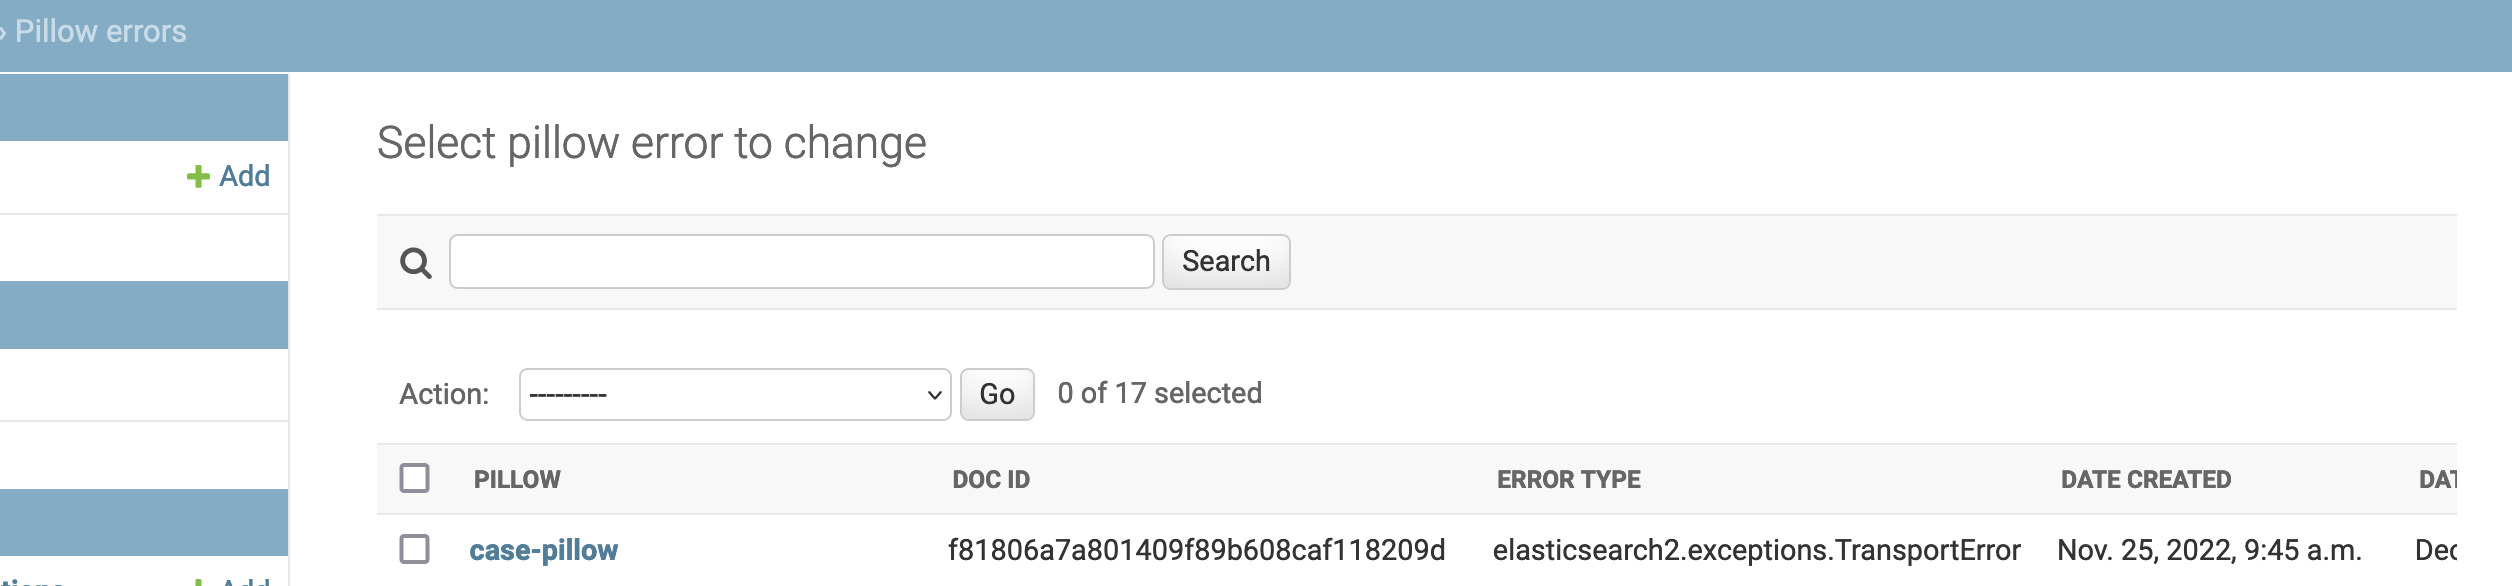
In django admin(/admin/pillow_retry/pillowerror/), no new pillow error is seen for data submitted on December 1.